Quick answer
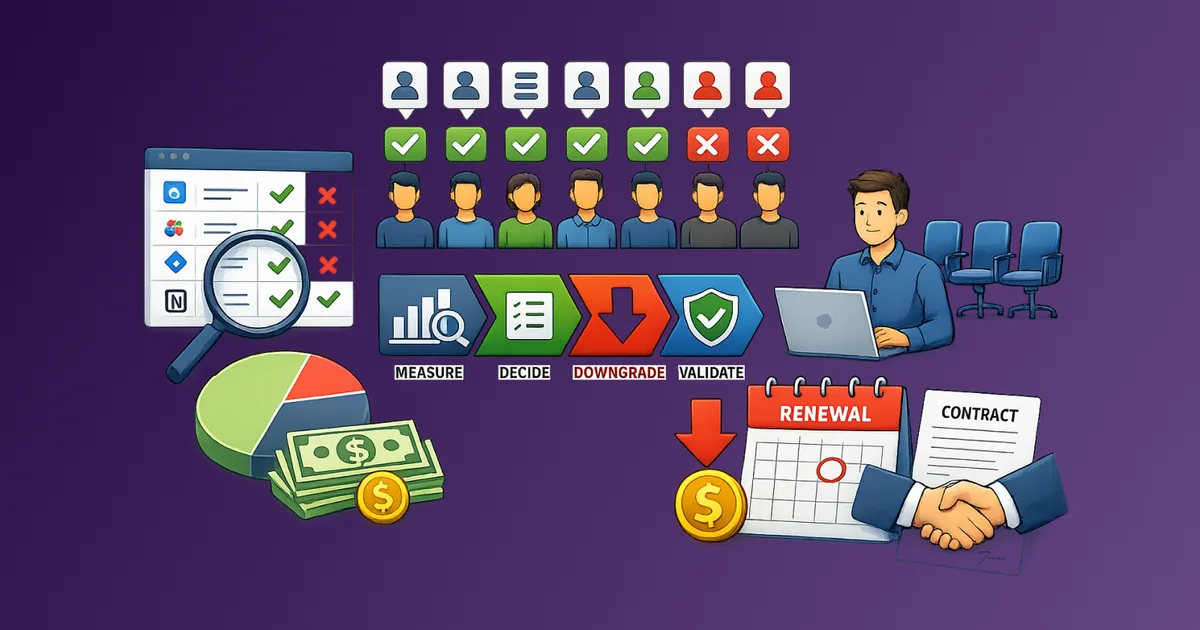
Cost per active user (CPAU) is monthly tool cost divided by the people who used it in the last 30 days. Total spend tells you the invoice. CPAU tells you whether that invoice is efficient. When headcount, seats, or family members change, total spend can stay flat while waste doubles. Track both, but make keep, cut, and rightsizing decisions on cost per active user.
Total spend is an easy number to report. It is also a weak number to manage. A stack that costs $2,400 this month can be healthier than one that costs $1,800, or far worse, depending on how many people actually use what you pay for.
Stay Updated with Subtrakr
Sign up to our newsletter to get updates about Subtrakr and valuable insights about subscriptions and recurring expense management.
What Is Cost per Active User?
Cost per active user is the amount you pay each month for one person who actually used a subscription.
The formula is:
Cost per active user = Monthly cost / Active users in the last 30 days
"Active" is not "has a seat." A provisioned license is a billing fact. An active user is a usage fact: someone who logged in, or completed a core action, during the review window. If you cannot name that person, they do not belong in the denominator.
This metric works for team SaaS, freelancer stacks, and household plans. Eight paid design seats with three people who opened a file this month means you pay almost three times the sticker price per seat. A streaming family plan with four slots and one person watching has the same problem at home.
CPAU is a ranking tool, not a universal benchmark. Compare a tool against its own history, a cheaper plan, and other tools that do the same job. A $90 analytics platform used by one analyst can still be a bargain. A $12 tool used by nobody is not.
Why Is Total Spend a Misleading Metric?
Total spend answers "how much left the account?" It does not answer "was that money working?" Subscription overload often looks calm on a statement because the monthly total barely moved. The waste is in the mix: fewer people using the same seats.
Three patterns make the invoice look fine while efficiency gets worse.
1. Spend stays flat while usage shrinks.
You still pay $2,400 a month. Six months ago, 24 people used the stack. Today, 12 do. Total spend says nothing changed. Cost per active user doubled from $100 to $200. That is the real story: orphaned seats, quiet churn, and tools nobody cancelled after a project ended.
2. Spend goes up while efficiency improves.
The team grew. You added seats because more people actually work in the tools. Total spend rose 50%. Cost per active user fell. A finance review that only sees the higher invoice will try to cut a stack that got healthier.
3. Cheap tools hide expensive waste.
Teams rank tools by invoice size and audit the biggest lines. A $99 analytics plan with one active user can cost more per person than a $600 platform with 30 active users. Total spend puts the $99 tool at the bottom of the worry list. CPAU puts it near the top.
You also cannot tell whether Tool A is "more expensive" than Tool B until you know how many people it serves. A specialist tool used by two people will always lose a total-spend contest against company-wide chat. That contest is not useful. Households hit the same trap: a family plan stays on the card after two people stop using it. The charge looks familiar. The cost per person who still uses it is not.
How Do You Calculate Cost per Active User?
Use monthly equivalent cost so annual plans do not look cheaper than they are. Divide the annual invoice by 12. Then divide by active users in the last 30 days.
| Tool | Monthly cost | Seats paid | Active users (30 days) | Cost per seat | Cost per active user |
|---|---|---|---|---|---|
| Project management | $240 | 12 | 12 | $20 | $20 |
| Design | $180 | 8 | 3 | $22.50 | $60 |
| Analytics | $99 | 5 | 1 | $19.80 | $99 |
| Streaming family plan | $23 | 4 | 2 | $5.75 | $11.50 |
Total spend says analytics is the cheapest line. Cost per active user says it is the most expensive person you pay for. Design looks moderate on the invoice and expensive once unused seats are visible. Project management is fully used: paid seats and active users match.
A useful extra column is the gap between cost per seat and cost per active user. When those numbers are close, people show up. When CPAU is at least 1.5 times the per-seat price, you are paying for empty chairs.
Define "active" before you pull numbers, and keep the definition stable:
- Default: at least one login in the last 30 days
- Better, when the admin panel allows it: at least one core action (file exported, task updated, report opened)
- Household plans: at least one session by that person, not "the TV was on"
If a tool has zero active users, record it as inactive and put it on the cancel list. Do not skip the row.
Usage-based and credit-based tools still fit. Use 30-day cost in the numerator and people who consumed usage in the denominator. If one person burns most of the credits, note it. CPAU will look low while concentration risk is high. Pair the number with a usage-to-cost ratio when you need intensity, not just headcount.
When Does Total Spend Still Matter?
Cost per active user should drive keep, cut, and seat decisions. Total spend still belongs on the same page for cash and risk.
Keep total spend in view when you need a budget cap, a cash report for a founder or partner, a check on vendor concentration, or a yes/no on whether an annual prepay is affordable. A price increase belongs here too: the invoice can jump before usage changes.
A tool can have a healthy cost per active user and still be unaffordable. Ten people using a $2,000 platform is efficient per person and still a cash problem if you cannot pay it. Then the move is a cheaper plan or a smaller vendor, not a celebration of the CPAU number.
The rule is simple: total spend is a constraint. Cost per active user is a quality score. Do not use the constraint as the quality score.
Step-by-Step Setup (Time required: 25 minutes)
You can run the first pass in a spreadsheet. Repeat it monthly. Decide on the flagged rows quarterly.
Step 1: List every recurring subscription with monthly equivalent cost.
Include seat count, billing cycle, and owner. Annual plans go in as cost divided by 12. Household plans go on the same list.
Step 2: Write down what "active" means for this pass.
Use 30-day login unless a tool has a clearer core action. Put the rule at the top of the sheet so next month matches.
Step 3: Pull active user counts.
Admin panels, SSO last-login reports, and family-plan activity screens are enough. If you cannot get a count, ask the owner who used it in the last 30 days. Blank owner plus blank usage is a cancel candidate.
Step 4: Calculate cost per active user and the seat gap.
CPAU = monthly cost / active users. Seat gap = paid seats minus active users. Sort by CPAU, then by seat gap.
Step 5: Flag rows with a simple rule.
- Zero active users: cancel or pause
- CPAU at least 1.5x the per-seat price: rightsizing review
- CPAU rising for three months: investigate even if total spend is unchanged
- Fully used and stable: leave it
Step 6: Act on the flags, do not just rank them.
Remove empty seats, downgrade the plan, switch to a cheaper tier, or cancel. For team tools, license rightsizing is the usual next move: cut unused seats first, then consider a lower tier. For family plans, recalculate against individual pricing before you renew.
Step 7: Recalculate after the change.
CPAU should fall when you remove empty seats. If it does not, usage dropped again or you cut the wrong seats. Check two to four weeks later so you do not lock in a bad downgrade.
Copy-Paste CPAU Scorecard
Tool | Monthly cost | Seats paid | Active users (30d) | Cost per seat | CPAU | Seat gap | 3-month CPAU trend | Action
-----|--------------|------------|--------------------|---------------|------|----------|--------------------|--------
     |              |            |                    |               |      |          |                    |
Action options: Keep / Rightsize seats / Downgrade plan / Pause / Cancel / Investigate
Trend options: Down / Flat / Up
What Does a High Cost per Active User Usually Mean?
A high CPAU is a signal. It is not an automatic cancel.
Fixable causes: seats left after someone left, a paid tool waiting on a delayed project, incomplete onboarding, seasonal use measured in the off month, or a shared login that hides real users.
Structural causes: the tool never replaced what it was bought to replace, a team plan bought for a one-person need, a cheaper individual plan that now beats the shared plan, one power user on a department license, or nobody knowing what the subscription is for.
If the cause is fixable, set a 60-day check and re-measure. If it is structural, cut, downgrade, or switch. Do not wait for total spend to look "big enough" to care.
For households, run the same logic against current individual prices. A family plan only saves money when cost per active user stays below the individual plan. When members drop off, that comparison flips. The family versus individual plan math is CPAU with a second number next to it: today's solo price.
Common Mistakes When Tracking Cost per Active User
Counting seats as active users.
This recreates total spend with extra columns. If eight seats are paid and three people used the product, the denominator is 3, not 8.
Using a 90-day window that hides churn.
A 90-day "active" definition keeps people in the count long after they stopped. Default to 30 days. Use 90 days only as a second column for roles that are genuinely infrequent, such as quarterly reporting or annual tax tools.
Comparing every tool on one CPAU leaderboard.
A security tool used by two admins will never "win" against a company-wide docs app. Group by job: communication, design, analytics, household streaming. Rank inside the group.
Ignoring shared logins.
One password shared by five people undercounts active users and inflates CPAU. Split the accounts, or note "shared login, treat as N users."
Treating one bad month as a verdict.
Vacation or a delayed project can crush a single month. Three months of rising CPAU, or a zero-usage month with no owner, is the decision trigger. Annual plans still belong on the sheet after you prepaid: rising CPAU mid-year is what you bring to renewal.
Managing only the biggest invoices.
Low-cost unused tools are still waste. CPAU catches the $12 and $19 lines that never appear in a "top 10 spend" review.
How This Fits Your Recurring Expense Workflow
Cost per active user answers "are we paying a fair amount per person who actually uses this?" Total spend answers "can we afford the stack this month?" Usage-to-cost ratio answers "is the tool being worked, or just opened?"
Use CPAU in the monthly review, next to cost and renewal dates. Use it again before you add seats or switch to annual billing. A recurring expense workflow that only watches the total will keep paying for empty seats as long as the total looks familiar.
FAQ
What is a good cost per active user?
There is no universal target. Judge a tool against its own cost per seat, against a cheaper plan or competitor, and against its CPAU three months ago. A rising trend with a growing seat gap is a stronger signal than any single number.
How is cost per active user different from cost per seat?
Cost per seat divides the invoice by licenses you pay for. Cost per active user divides it by people who used the product. When those numbers diverge, you are paying for unused access. Rightsizing exists to close that gap.
Does this work for usage-based or credit-based tools?
Yes. Put the last 30 days of cost in the numerator and the people who consumed usage in the denominator. Add a note if one person accounts for most of the usage. Low CPAU plus one heavy user is a concentration issue, not a fully healthy tool.
What if a tool has a shared family or team login?
Count the people who actually used it, not the number of profiles on the plan. If you cannot tell, fix the login model first. A metric you cannot count is a metric you cannot manage.
How often should I recalculate cost per active user?
Collect counts monthly. Act on zeros immediately. Make keep, cut, and downgrade decisions quarterly unless CPAU jumps after a departure, a price increase, or a failed rollout.
Does this apply to personal subscriptions?
Yes. For a solo plan, "active users" is you: did you use it at least once this month? If not, CPAU is the full monthly price for zero value. Cancel or pause. If several people share a plan, use the household formula.
Next Action
Pick your ten highest-cost subscriptions. For each one, write monthly cost, paid seats, and 30-day active users. Sort by cost per active user, not by invoice size. This week, act on every row with zero users or a CPAU well above the per-seat price.
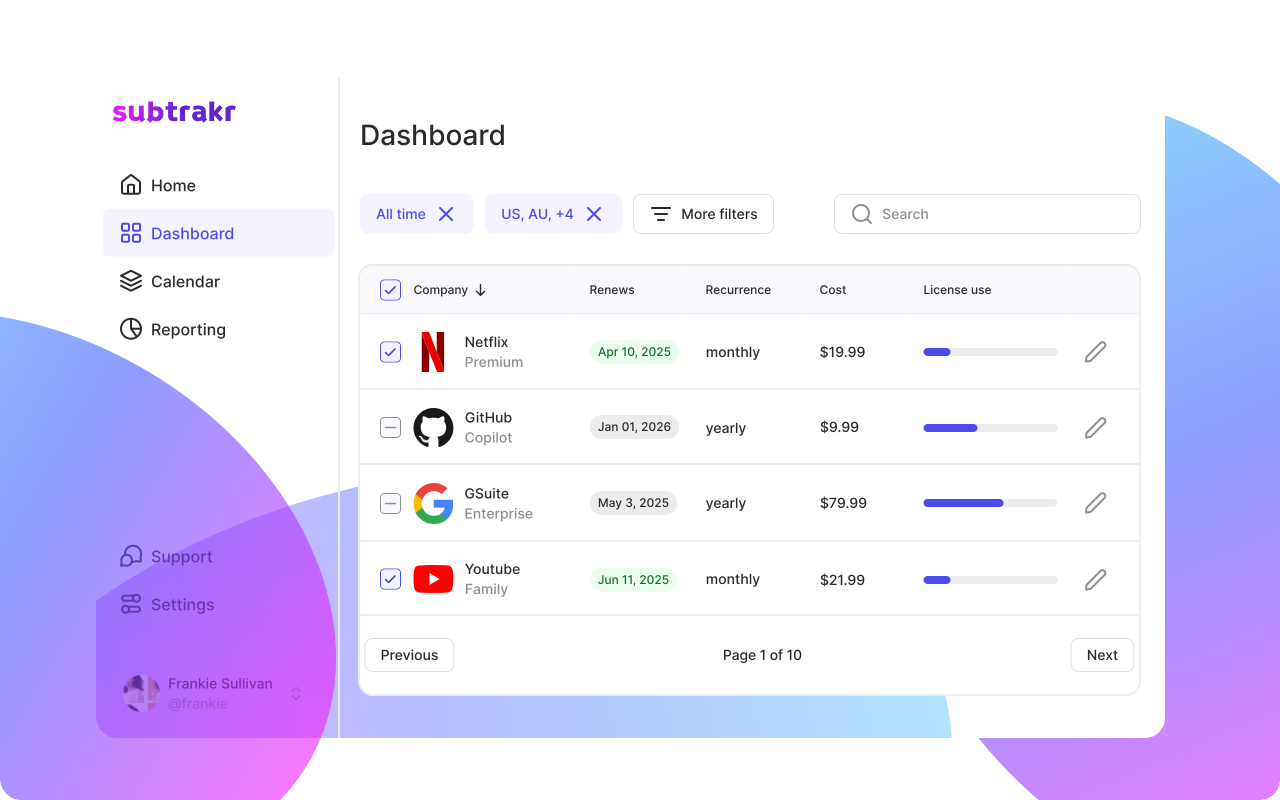
Subtrakr keeps the cost side of this scorecard in one place: monthly equivalents, categories, and renewal dates. Add active user counts next to those costs and you have a metric you can actually manage.