Quick answer
A switching cost is the total price of moving from one subscription to another, beyond the price difference itself. It includes migration cost (time and tools needed to move your data), learning curve cost (lost productivity while you adapt), and downtime cost (disruption to your work or business during the transition). To decide if switching is worth it, add these three costs to the new tool's price and compare that total against what you currently pay, not just the monthly fee.
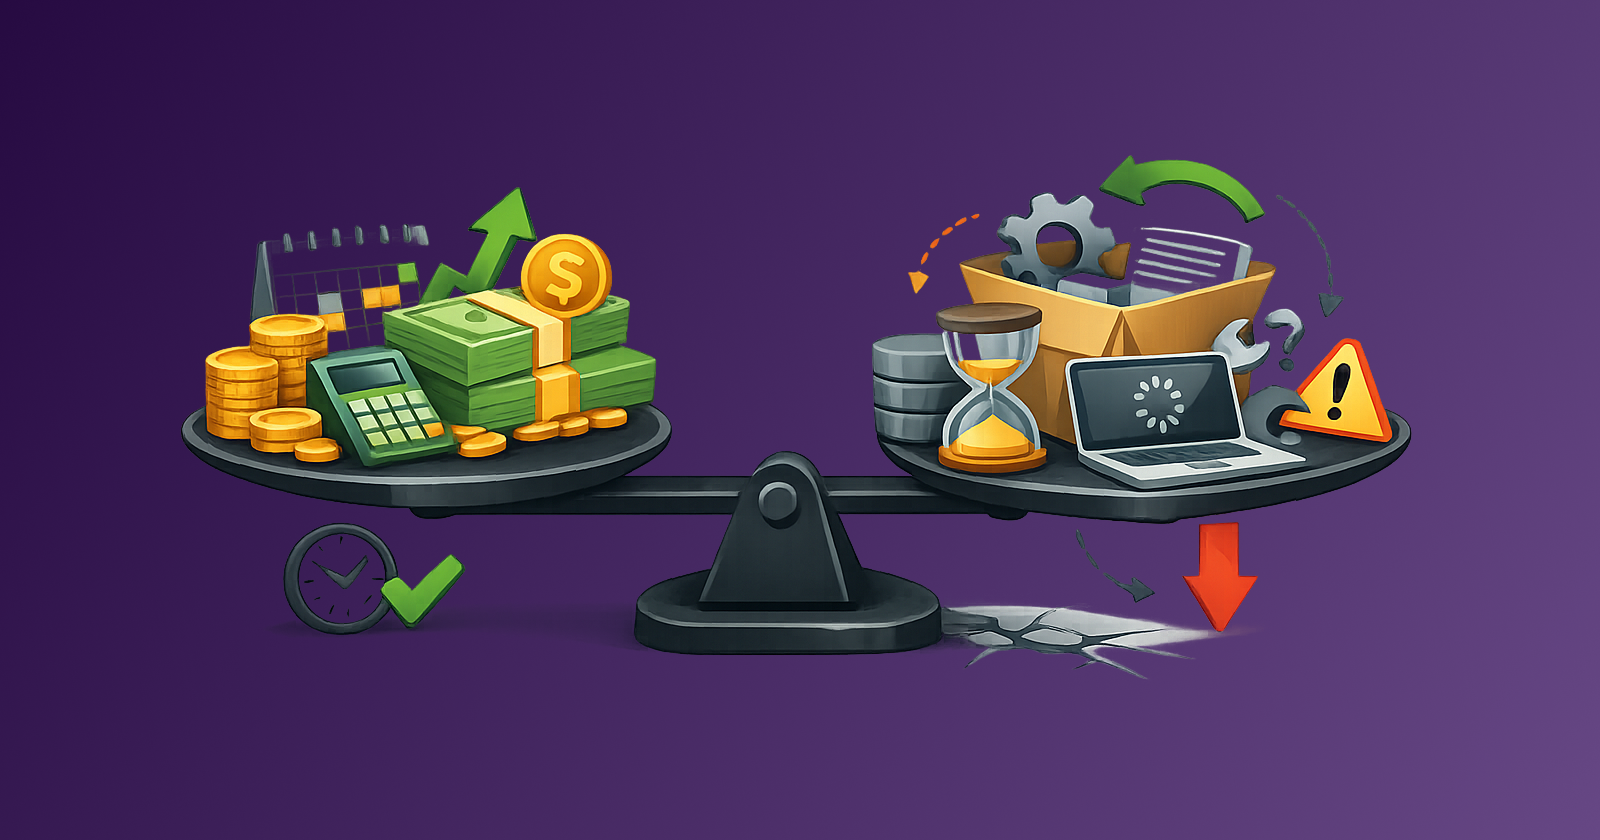
A lower sticker price is not the same as a lower total cost. Every time you switch a subscription tool, whether it's a project management app, a streaming service, or a piece of business software, you pay a hidden bill on top of the new subscription fee: migration time, a learning curve, and disruption while your workflow adjusts. Ignore that bill and a "cheaper" tool can end up costing more than the one you left. This guide gives you a simple framework to calculate switching costs before you commit.
Stay Updated with Subtrakr
Sign up to our newsletter to get updates about Subtrakr and valuable insights about subscriptions and recurring expense management.
What Counts as a Migration Cost?
Migration cost is what it takes to physically move from the old tool to the new one. This is the most visible switching cost and the easiest to underestimate.
It includes:
- Time spent exporting data from the old tool and importing it into the new one
- Fees for migration services or third-party import tools
- Time spent rebuilding integrations, automations, or custom workflows
- Time spent auditing the migration for errors or missing data
For a simple tool like a note-taking app, migration might take an hour. For something like accounting software or a CRM, it can take days or weeks, especially if historical data needs to be reformatted or manually checked.
Estimate migration cost as: (hours required) x (your hourly rate, or your team's blended hourly rate).
How Do You Calculate the Learning Curve Cost?
Learning curve cost is the productivity you lose while you and your team figure out how the new tool works. Even a well-designed replacement rarely performs as well as a tool you already know on day one.
To estimate it:
- Estimate how many hours per week you'll spend at reduced efficiency (searching for features, redoing tasks, asking for help).
- Estimate how many weeks it will take to return to your previous efficiency level.
- Multiply those hours by your hourly rate.
A rough rule of thumb: for a tool used daily, expect two to four weeks of noticeably reduced efficiency, tapering off gradually. For a tool used occasionally, the learning curve is shorter but resets more often, since infrequent use means you re-learn parts of the interface each time.
If multiple people use the tool, multiply the per-person cost by the number of users. This is where switching costs scale fast in teams: a five-person team switching project management tools can lose more in combined learning curve time than a full year of subscription savings.
What Is Downtime Cost and How Do You Estimate It?
Downtime cost is the value lost when work stops or slows down during the actual transition window, separate from the ongoing learning curve. This includes:
- Missed deadlines or delayed deliverables caused by the switch
- Customer-facing disruptions, such as a support tool going offline during migration
- Coordination overhead, like scheduling the cutover and communicating it to a team or clients
Downtime cost is highly situational. Switching a personal budgeting app has close to zero downtime cost. Switching the tool your customer support team uses to answer tickets can have a real, measurable cost if response times slip during the transition.
If downtime is likely, estimate it in concrete terms: lost revenue, refunded time, or the cost of a temporary workaround, not just "some inconvenience."
When Is a Cheaper Subscription Not Actually Worth Switching To?
A cheaper tool is not worth switching to when the combined migration, learning curve, and downtime costs exceed what you'd save over a realistic time horizon, usually 12 months.
Use this comparison:
Total switching cost = Migration cost + Learning curve cost + Downtime cost
Break-even point = Total switching cost ÷ Monthly savings
If the break-even point is longer than you'd realistically keep the new tool, especially in a fast-moving software category, the switch is likely not worth it. If the break-even point is a few weeks or months and you plan to use the tool for years, switching makes sense.
Step-by-Step Setup (Time required: 15 minutes)
- List the price difference. Write down what you currently pay and what the new tool costs, monthly and annually.
- Estimate migration hours. Be specific: data export, data import, integration rebuilding, error checking.
- Estimate learning curve hours. Multiply weekly productivity loss by the number of weeks it will take to recover, then by the number of users.
- Estimate downtime cost. If none applies, mark it zero. Don't inflate this if the switch genuinely has no disruption risk.
- Convert everything to a dollar (or your local currency) figure using an hourly rate that reflects your real time value, not a rounded guess.
- Calculate the break-even point using the formula above.
- Decide against your actual usage horizon, not against the annual subscription price alone.
Copy-Paste Switching Cost Calculator Template
Current tool: ___________          Monthly cost: $______
New tool: ___________              Monthly cost: $______
Monthly savings: $______

Migration cost:
  Hours required: ______  x  Hourly rate: $______  =  $______

Learning curve cost:
  Weekly productivity loss (hrs): ______
  Weeks to recover: ______
  Number of users: ______
  x Hourly rate: $______  =  $______

Downtime cost:
  Estimated impact: $______

Total switching cost: $______
Break-even point (Total switching cost ÷ Monthly savings): ______ months

Decision: Switch if break-even is shorter than your realistic usage horizon.
Common Mistakes When Estimating Switching Costs
- Comparing sticker prices only. A $5 monthly saving means little if migration alone costs $200 in lost time.
- Ignoring team-wide learning curve costs. One person's adjustment period is manageable. Multiplied across a team, it's often the largest cost in the entire calculation.
- Treating downtime as zero by default. Even low-risk switches can have small, real costs, like the time spent notifying collaborators or resetting saved logins.
- Using an unrealistic hourly rate. Round numbers that ignore your actual time value (or your team's loaded cost) make the calculation meaningless.
- Forgetting recurring migration costs. Some switches aren't one-time, such as tools that require periodic re-import of data from other systems. Factor in whether the cost repeats.
FAQ
Is a switching cost calculator only useful for business software?
No. It applies to any recurring subscription where a transition takes real time or effort, including personal finance apps, streaming bundles, or productivity tools.
How do I estimate my hourly rate if I'm not billing hourly?
Divide your monthly income (or your team's monthly cost) by your actual working hours in a month. Use that figure consistently across the calculation.
What if the new tool has a free migration service?
Migration cost still applies to your time spent reviewing, testing, and correcting the migrated data, even if the transfer itself is automated.
Should I include emotional or team morale costs?
It's reasonable to note them, but keep the core calculation quantitative. Use morale impact as a qualitative factor alongside the dollar figure, not inside it.
How often should I run this calculation?
Any time you're considering a switch driven primarily by price, and periodically during your regular subscription audit, since switching costs change as your usage and team size change.
Does a longer subscription commitment change the math?
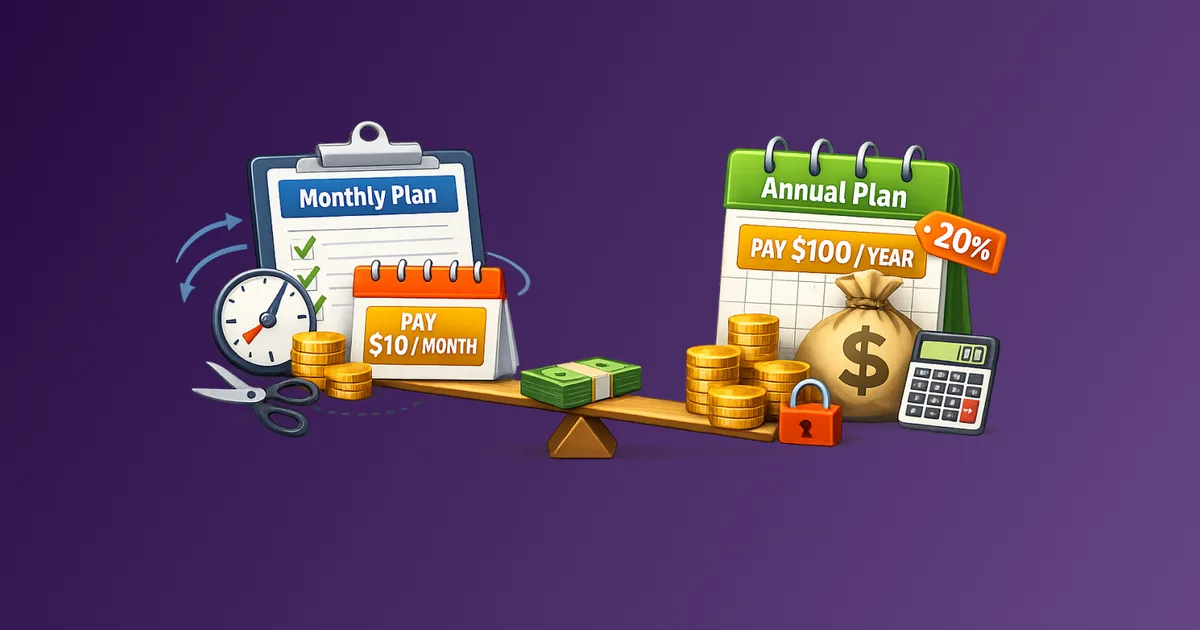
Yes. Annual contracts extend your usage horizon, which usually lowers the relative weight of switching costs and can make an otherwise marginal switch worthwhile.
Next Action
Before your next subscription renewal, run the calculator above on any tool you're considering replacing. If the break-even point is longer than you'd realistically keep the new tool, stay put and revisit the decision at your next audit instead. When evaluating the replacement itself, verify data export and exit terms first with a subscription procurement checklist so migration risk is clear before you commit.